K Means Cluster
K Means is the most famous unsupervised machine learning algorithm.
What is Cluster?
It is a collection of similar data points or points having similar properties.
Like in this graph we can group them into two clusters.
How do we group clusters?
Let us take an example of iris dataset. For simplicity purpose we will use only 2 features of iris data set.
Let’s do some standard imports:
import pandas as pd
from sklearn.cluster import KMeans
import matplotlib.pyplot as plt
from sklearn.datasets import load_iris
%matplotlib inline
Let’s load our dataset and convert into dataframe
iris = load_iris()
df =pd.DataFrame(iris.data,columns=iris.feature_names)
df.head()
Droping other two features for simplicity
df=df.drop(['sepal length (cm)', 'sepal width (cm)'], axis = 1) ;
df.head()
We will scatter these two features on a scatter plot
plt.scatter(df['petal length (cm)'],df['petal width (cm)'])

Now what we do is try to encircle the clusters of similar data points on our graph . To do that we need to find the centroid of each clusters.
How to find centroids of each cluster?
Let’s say we want to form two clusters (will discuss about this assumption later). So at random we plot two points on our graph .
Step-1
Now we will join these two points (let’s call it centroids for now) by a line and draw a perpendicular at mid-point of this line . This perpendicular lines divides the data points into 2 sets.

Step-2
Now based on red data points mean value we will place the centroid and similar thing happens with green data point and its centroid. And we will repeat both steps until there is no point movement.

How to find correct number of clusters K ?
There is something called SSE i.e Sum of Squared Errors.
The formula is :-

Here x refers to data points and c1 to centroid, SSE1 is the squared error of 1 cluster.
Similarly we will have SSE2 for 2nd cluster ,SSE3,SSE4…. so on.
We find the total sum of these squared errors SSE = SSE1 + SSE2 ….

As you increase the clusters there will be decrease in error . You can relate the above diagram as your arm and choose the point where there is sudden abrupt change let’s say elbow point. That is your K value .
## Let’s continue our code:
 km = KMeans(n_clusters=3)
yp = km.fit_predict(df)
yp
Setting no. of clusters as 3 and predicting the output.
df['cluster'] = yp
df.head(2)
df1 = df[df.cluster==0]
df2 = df[df.cluster==1]
df3 = df[df.cluster==2]
Creating 3 seperate data frames whose output is 0,1,2 respectively.
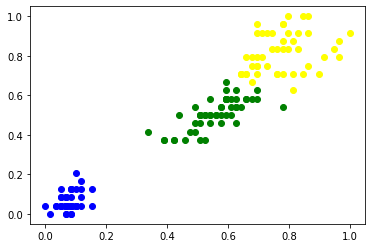
plt.scatter(df1['petal length (cm)'],df1['petal width (cm)'],color='blue')
plt.scatter(df2['petal length (cm)'],df2['petal width (cm)'],color='green')
plt.scatter(df3['petal length (cm)'],df3['petal width (cm)'],color='yellow')
sse = [] ## Sum of squared error
k_rng = range(1,10) ## range of K
for k in k_rng:
    km = KMeans(n_clusters=k)
    km.fit(df)
    sse.append(km.inertia_) ## gives sum of squared error
plt.xlabel('K')## ploting in graph
plt.ylabel('Sum of squared error')
plt.plot(k_rng,sse)

So you can infer the value of appropriate K.
That’s all Thank You!